To ensure their retention and settling function, stormwater treatment facilities must be checked regularly – usually annually – for sediment inflow. If deposit thicknesses or volumes are exceeded, they are then cleaned out at great effort and expense.
Accurately recording sediment inflow is difficult, especially for facilities with a permanent pool, and is usually done only by spot checks. Combined with complex basin geometries, this approach can lead to grossly incorrect results and is therefore often unsuitable as a basis for decisions and planning. The following shows the typical pitfalls using an example from real-world practice and presents a solution for more accurate surveys.
Key facts at a glance
The usual approach “water surface area × mean sediment thickness” can be grossly wrong for small basins with sloping banks.
In a practical comparison: deviations of up to 100% of the calculated sediment volume.
Sample calculation: 202 m³ calculated – actually only 76.2 m³.
Remedy: take the basin geometry into account, use significantly more sampling points, use the sediment area instead of the water surface area – or measure area-wide.
Common spot measurements with a sounding rod
Sediment thickness is usually measured with a sounding rod. In the simplest case, the rod is driven from the water surface down to the bed; when it is pulled back in, the material adhering to it directly shows the sludge thickness. However, the water surface of basins with a permanent pool is usually difficult to access; only rarely, with favorable geometries or from jetties, can the deeper areas of the facility down to the bed also be reached from the bank.
Boats therefore often have to be used, which is cumbersome and requires extensive safety measures, in order to obtain even coverage of the entire facility area. The measurements usually remain limited to a few points, and their positions are documented only schematically.
Gross errors caused by the averaging approach “water surface area × mean sediment thickness”
Once the supposedly representative samples have been taken, they are usually aggregated into an average sediment thickness by simple averaging and then converted into a sediment volume by multiplying by the water surface area. This approach is perfectly appropriate for larger facilities and ponds. For small basins and ponds with complex bed profiles and sloping banks, however, gross errors can occur that go far beyond the usual level of measurement uncertainty. This particularly affects settling basins, which usually have these characteristics.
This insight emerged recently during actual facility surveys using the alternative method presented below, which delivers exact results. A comparison with surveys from recent years that had been carried out using the averaging method showed deviations of up to 100% of the calculated sediment volume. As a result, either unnecessary rehabilitation work may have been initiated in the past or work that was actually necessary may have been omitted (the volume deviations can be both positive and negative). This prompted the author to publish this article to raise awareness of the issue.
Sources of error and possible improvements to the averaging method
The old and newly measured sediment thicknesses from the facility surveys were quite comparable (short interval between them); the error therefore had to lie in the distribution of the samples and the averaging evaluation. To illustrate this, here is an abstracted but real survey example of a typical settling basin:
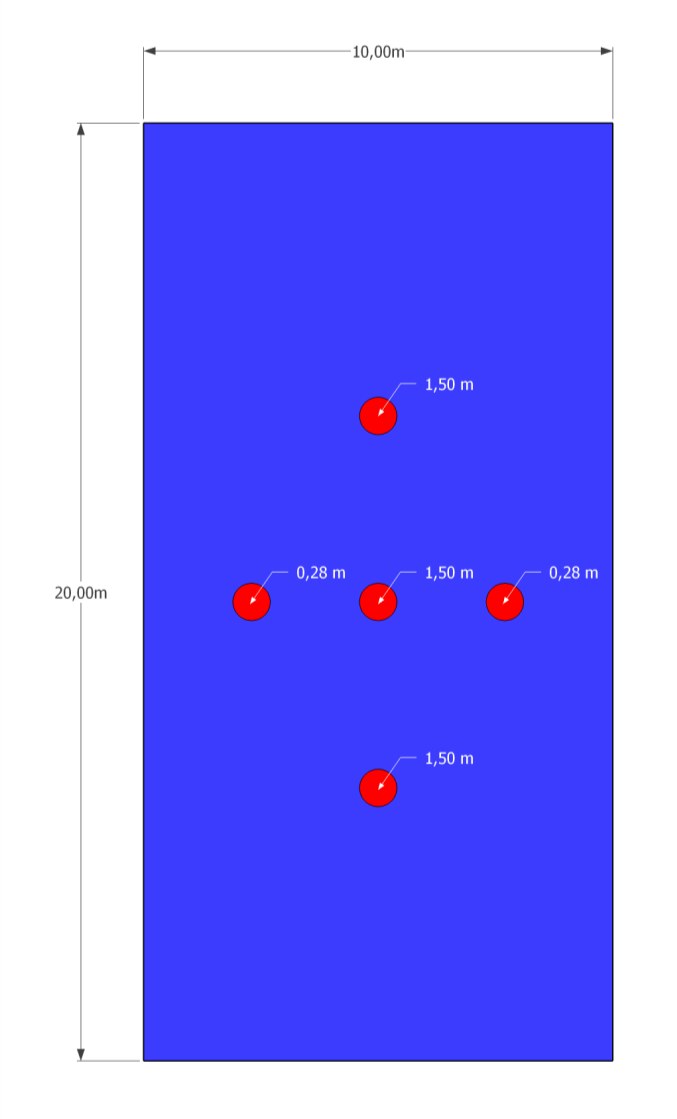
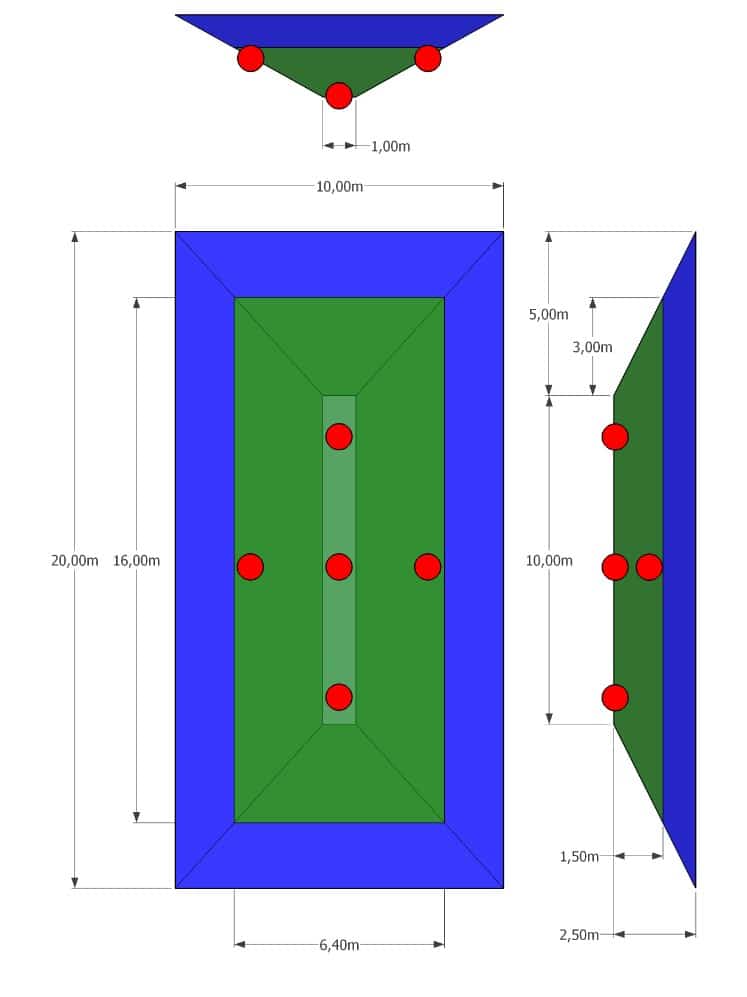
Originally, five reasonably evenly distributed soundings were taken within the water surface (Figure 1). The calculation using the averaging method (Table 1) gives a volume of 202 m³. However, the geometry of the basin and the sediment inflow (Figure 2) result in an actual volume of 76.2 m³!
Figure 1: Plan view of the water surface with the positions of the soundings and the measured sludge thickness
Figure 2: Geometry of the basin, the water body (blue) and the sediment deposits (green), whose surface is modeled as a plane of constant height; positions of the original soundings (red)
Looking at the basin geometry, it becomes clear that the soundings, which at first appear reasonably evenly distributed over the area, in reality give greater weight to the deep areas of the basin with higher sediment loads – the mean value is therefore no longer representative.
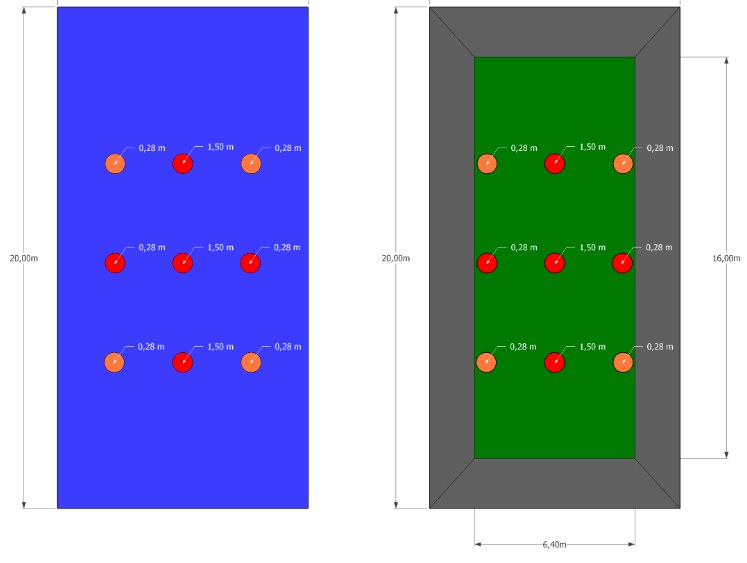
A possible first attempt at improvement is to add further soundings, especially in the edge areas (Figure 3, left). As a final correction, the actual sediment area is used instead of the water surface area (Figure 3, right).
Figure 3: Step-by-step improvements – additional soundings (left) and use of the sediment area (right)
Table 1: Volume calculation with step-by-step improvement of the result
Calculation
Mean (sediment) thickness
Area
Volume = area × mean thickness
Original measurement (Figure 1)
1/5 × (3 × 1.50 m + 2 × 0.28 m) = 1.01 m
Water: 10 m × 20 m = 200 m²
200 m² × 1.01 m = 202 m³
Extended measurement (Figure 3, left)
1/9 × (3 × 1.50 m + 6 × 0.28 m) = 0.69 m
Water: 10 m × 20 m = 200 m²
200 m² × 0.69 m = 137 m³
With sludge area (Figure 3, right)
1/9 × (3 × 1.50 m + 6 × 0.28 m) = 0.69 m
Sediment: 16 m × 6.40 m = 102.40 m²
102.40 m² × 0.69 m = 71 m³
This value finally corresponds to the actual volume with sufficient accuracy. The following conclusions can be drawn from this example:
Even if the samples are evenly distributed over the area, their mean value can be heavily misweighted depending on the basin geometry and distribution, making it useless for determining volume.
The basin geometry must therefore be taken into account when planning the soundings and in the evaluation.
Reliable volume determination requires far more sampling points than have usually been used to date.
The sediment area, rather than the water surface area, should preferably be used as the multiplier – especially if sounding is not possible right up to the shoreline (shallows, underwater vegetation, reed areas).
In practice, implementing these recommendations is likely to involve considerable effort or even be impossible. An alternative approach therefore suggests itself, which is usually much faster and cheaper and at the same time delivers more exact volumes.
The solution: area-wide surveys with Geospector DTS Acqua
The above conclusions lead to the following approach:
high-resolution, area-wide measurement instead of individual sampling points
consideration of the actual bed profile in the evaluation
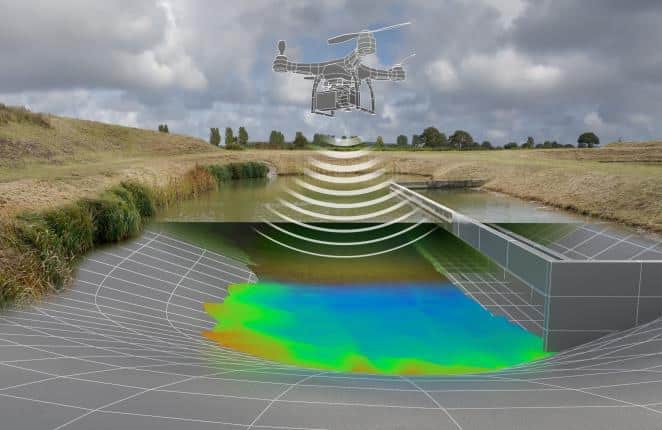
In contrast to the individual manual soundings of the averaging approach, all measurements are carried out comprehensively, in detail and automatically using specialized drone sensors (air, water, underwater) (Figure 4).
Figure 4: Geospector DTS Acqua (symbolic image)
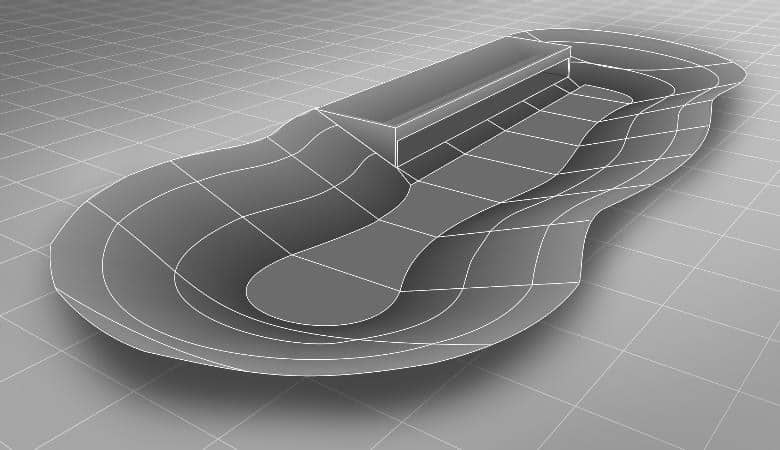
Bed profile: First, the bed profile or geometry of the basin is reconstructed by automated soundings (cross-sections and longitudinal profiles) (Figure 5). If plans already exist, they are first checked for plausibility by measurements and incorporated. The result is an accurate model of the artificial or natural bed profile.
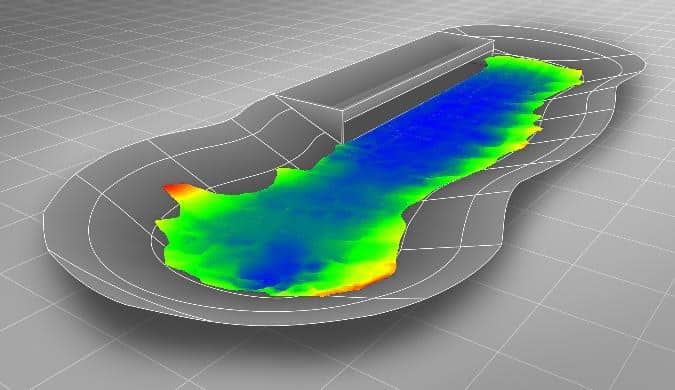
Sediment level: In the second step, the sediment level is captured across the entire water surface with full coverage and in high detail (Figure 6). In areas that are difficult to access (e.g. reed belts), a specialized flying drone is used for this. The result is an accurate depth model of the deposits, and critical points with high inflow can easily be identified.
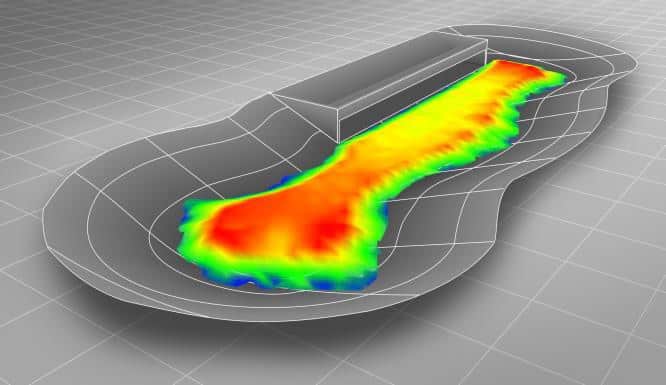
Volume: In the last step, the two models are rasterized (typically 0.50 m × 0.50 m) and the height differences between them are calculated, which correspond to the sediment thicknesses at the respective grid points. Integration over the entire facility area then gives the exact sediment volume (Figure 7).
Figure 5: Model of the bed profile
Figure 6: Surface of the sediment deposits
Figure 7: Sediment thicknesses and volume after rasterization, differencing and integration
Depending on requirements, these basic data can then be further processed into 2D and 3D plans, condition reports, visualizations, etc.
Thanks to the latest drone and sensor technology, this approach is actually faster and more economical than conventional methods – while offering unrivaled precision.
Further technical articles on stormwater retention facilities
Supplement: Pitfalls in determining sediment volume (this article)
Have the sludge depth in your facilities measured?
With the Geospector Sludge Check, we survey the sediment surface and bed of your stormwater retention facilities area-wide by drone – without a boat and without the need for an existing baseline survey.