Dipl.-Ing. David Mauro, Geospector Munich · First published in the special issue “Messtechnik im Bauwesen 2023” (Ernst & Sohn Special 2023, pp. 31–33)
The use of remotely controlled sensors in the air, on the water and on the ground promises to become extremely exciting in the coming years – not only as an alternative to conventional surveying, but also by opening up entirely new fields of application. Efficient depth measurement of natural and artificial small water bodies is finally possible as well: ponds, lakes and basins can now be surveyed and inspected within a very short time using innovative drone sensors. This is particularly important for critical and dynamic water bodies with heavy sediment and sludge inflow. Municipalities, operators and maintenance managers as well as hydraulic engineers in particular have a growing and often urgent, but repeatedly postponed need here.
Key facts at a glance
Ponds, lakes and basins are surveyed area-wide by drone – without jetties, cranes or boats.
An average small water body is captured in around one hour; with RTK GNSS, accuracy is in the centimeter range down to a water depth of 25 m.
The deposit surface and the bed are measured separately – the difference gives the sludge or sediment thickness.
Result: a depth model plus sediment volume, empty volume and remaining storage capacity as a basis for decisions on rehabilitation and sediment removal.
The DTS Acqua measuring method
Until now there was no simple solution: sounding required jetties to be built or cranes to be set up, and boats often could not be used because there was no access. Even under optimal conditions, measurements were only possible at individual points – ideally the critical ones – and accurate documentation had to be prepared manually.
This is where the DTS Acqua measuring method, developed by the drone specialist Geospector, offers a solution that is available as a service: Geospector’s drone laser mapper has been extended with additional sensors such as sonar, an efficient sounding system and an underwater camera to form DTS Acqua.
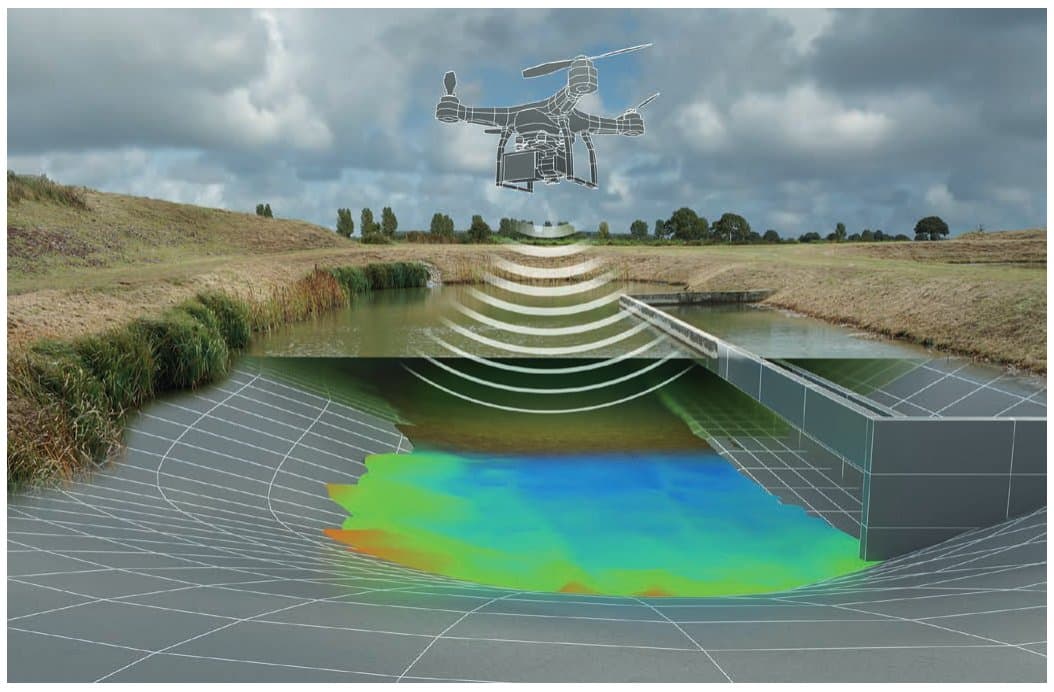
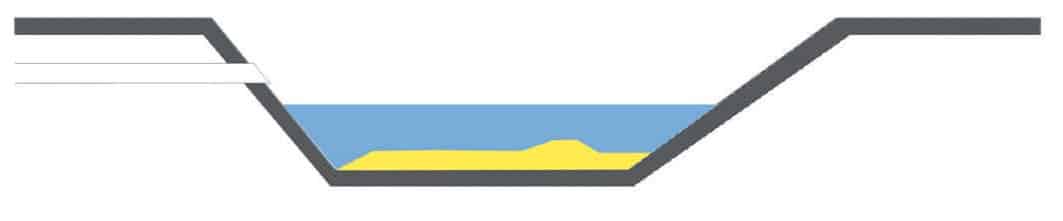
Figure 1: Schematic representation of depth measurement by drone
Without any further preparatory work, area-wide depth models can thus be surveyed within a very short time – in contrast to spot soundings. Using RTK GNSS, accuracy is in the centimeter range at water depths of up to 25 m. The measurement data are processed and documented during the survey and immediately visualized on a map, so that critical areas, for example, can be examined in more detail.
This measuring method therefore offers a completely new approach to bathymetric surveys: it has never been so easy – and at such low cost – to produce exact, area-wide depth models. The measurement data can be further processed into point clouds and CAD models and used for comparisons with the design profile and for volume calculations.
The depth model of an average small water body can be captured over its entire area within one hour. The subsequent comparison with the design profiles (geometric basins or near-natural ponds) yields the loss of storage capacity from the area-wide distribution of sludge and sediment thicknesses.
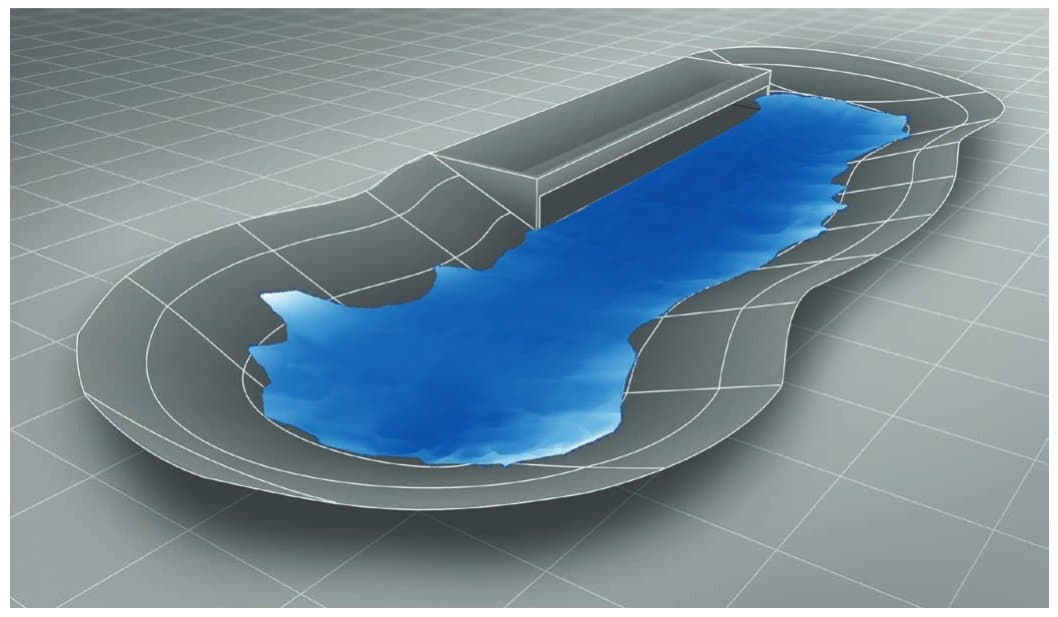
Figure 2: Deposition of inflowing sediment and sludge on the basin bottom
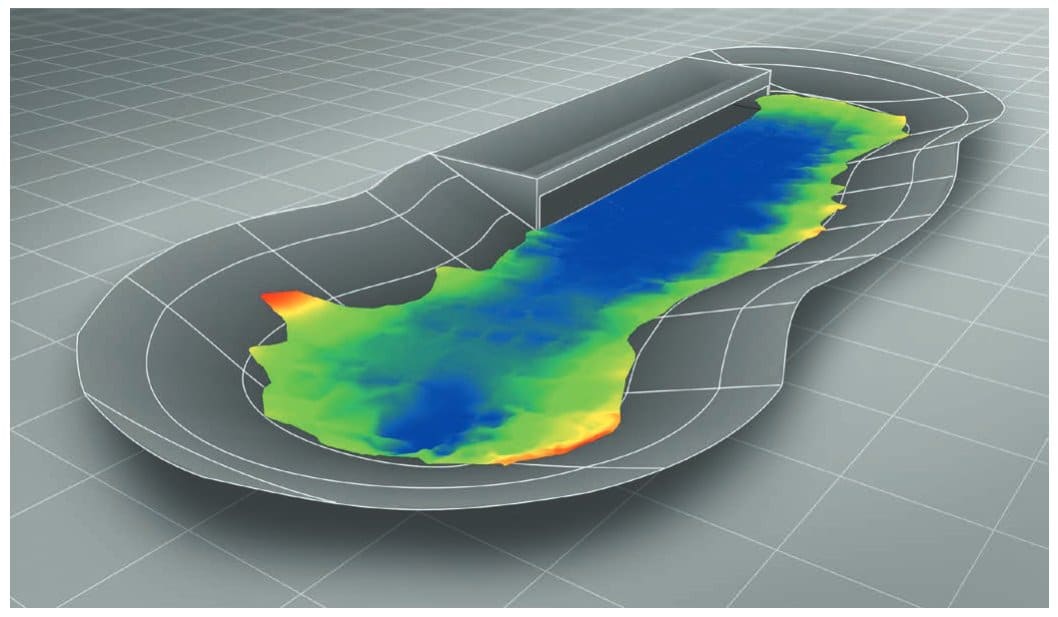
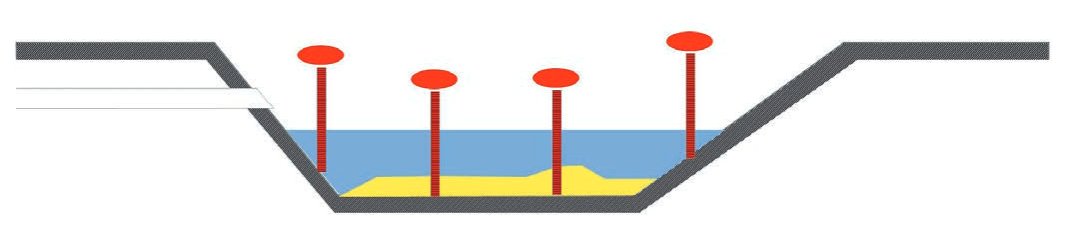
Figure 3: Depth measurement of the basin bed
Explanation of the method using a stormwater retention basin (RRB) as an example
Determining sludge thickness and loss of storage capacity
Stormwater retention facilities require a minimum storage capacity for safe operation, which decreases over time due to the inflow of sludge and sediment. Continuous monitoring is therefore necessary. For facilities with a permanent pool, this has so far been very laborious (sounding from inflatable boats or jetties) and has therefore usually been carried out – if at all – only at a few individual points.
Many facilities were built decades ago, and there is great uncertainty about the bed profile because exact plans are missing, modifications have not been adequately documented and no baseline surveys were carried out. DTS Acqua can therefore also determine the bed profile, make up for missing baseline surveys and update inaccurate plans. With this reliable basis for decisions, the costs of rehabilitation and desludging measures can be minimized and ideally even avoided altogether.
Conventional approach: sounding
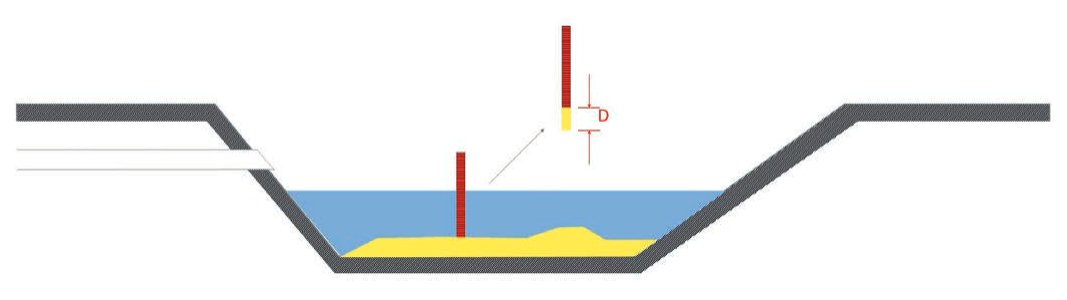
Until now, sounding was the only option. A sounding rod is pushed vertically through the deposits down to the bed at selected points from the bank, a jetty or a boat; after the rod has been pulled out, the deposit thickness D is determined directly from the material adhering to it. With gravel or similar material this method fails, and one can try to estimate the thickness from the water level read off when the rod touches the deposit surface. There is no automatic documentation of position and thickness, and the procedure is usually limited to a few spot samples.
Figure 4: Conventional sounding
Approach with DTS Acqua
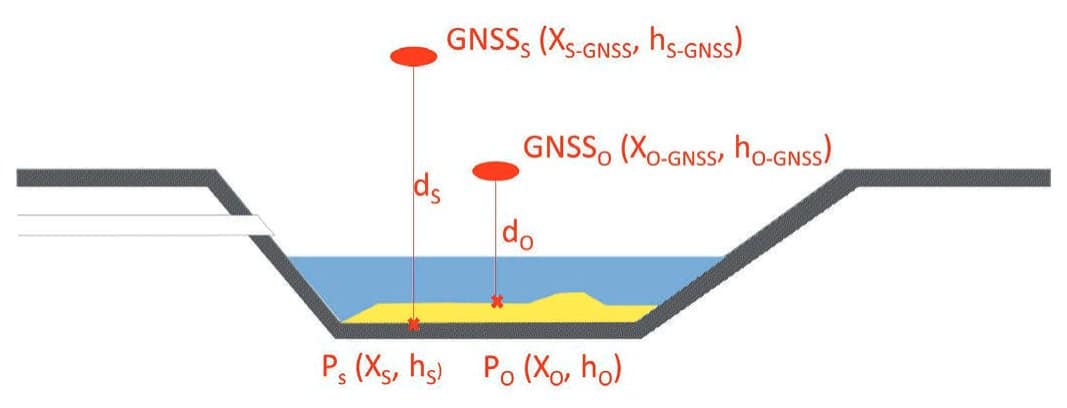
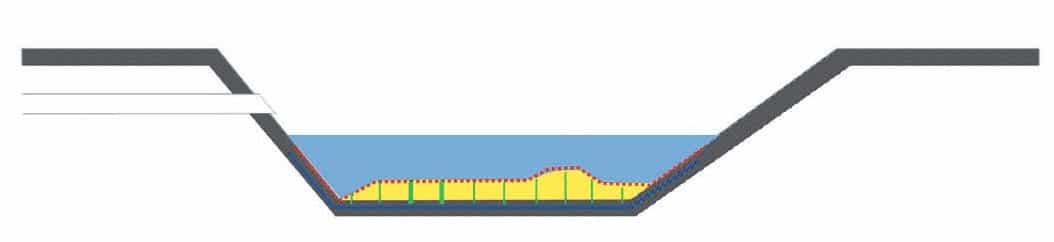
In contrast to conventional sounding, the deposit surface and the bed level are measured separately. Depending on local conditions, a wide range of drone-based and manual methods (laser scanning, sonar, automatic sounding, etc.) is available for efficient, area-wide data capture. In addition to the vertical distances h, all methods uniformly record the centimeter-accurate position coordinates X using RTK GNSS and transmit them to a server in real time for further processing.
The deposit thickness D is then obtained as the difference between the absolute heights of the top of the deposit and the bed (equation 1):
D = hO – hS = hO-GNSS – dO – (hS-GNSS – dS) (1)
Figure 5: Deposit thickness D
In practice, CAD plans or hand sketches of the water body geometry are usually available, so only a few measurements of the bed profile are needed to check the plausibility of the plans and correct them if necessary. In this case, the procedure is as follows:
Spot measurement of the bed profile
Area-wide measurement of the deposit surface
Definition of the height and geo-reference for matching the CAD data with the GNSS measurements
Modeling of the bed, including a plausibility check using step 1 and corrections if necessary
Determination of the deposit thicknesses by calculating the difference
Further evaluations such as volume calculations
1. Spot measurement of the bed profile
Several cross-sections and longitudinal profiles are recorded with the sounding drone. If the bed geometry is unknown or natural, existing CAD plans can be dispensed with by densifying the measurements accordingly, and the bed geometry can be determined solely from the automated soundings.
Figure 6: Spot measurement of the bed profile
2. Area-wide measurement of the deposit surface
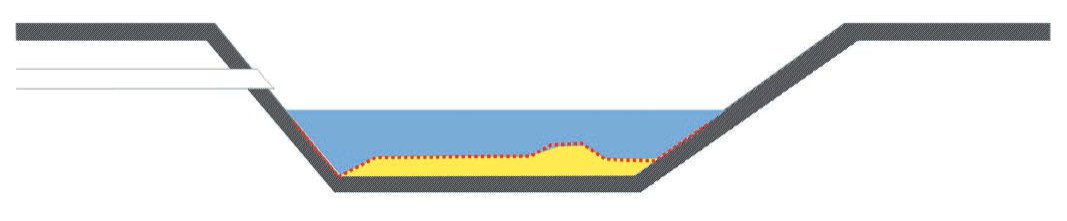
The entire deposit area is captured densely by sonar or bathymetric laser scanning, so that local accumulations or scour can also be identified in detail.
Figure 7: Measurement of the deposit surface
3. Definition of the height and geo-reference
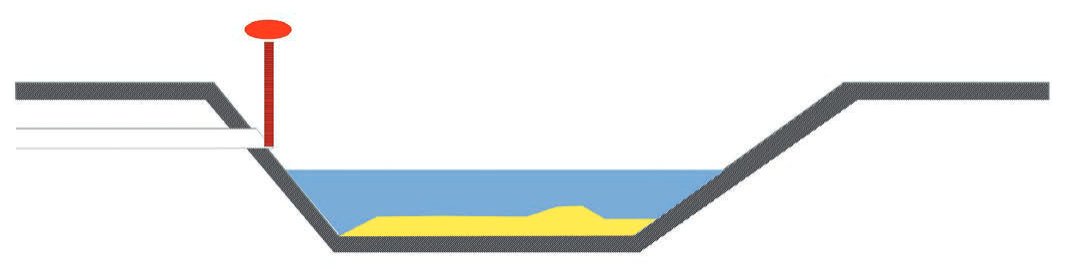
Several ground points for which the CAD plans contain height information (e.g. the bottom edge of the inlet) are surveyed using RTK GNSS. After a plausibility check, the transformation parameters from the CAD plan to the current GNSS system are determined.
Figure 8: Definition of the height and geo-reference
4. Modeling the bed
The CAD plans are transformed and checked for plausibility using the bed soundings, any deviations are corrected, and a 3D depth model of the bed is created.
Figure 9: Modeling the bed
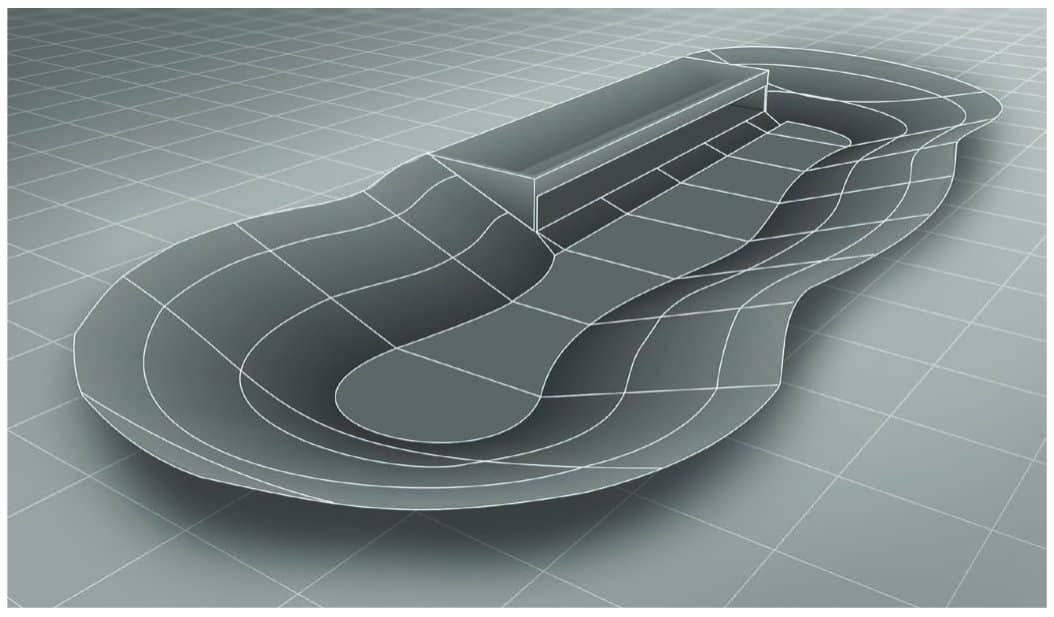
Figure 10: The geometry of the retention basin after construction, in its empty state
5. Determining the deposit thicknesses D
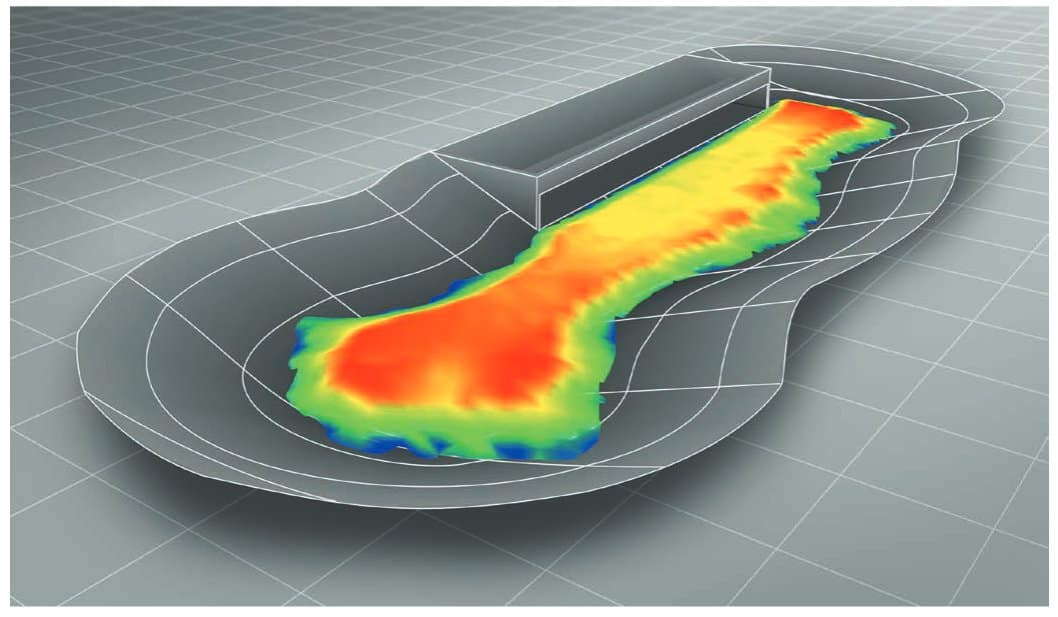
The corresponding height values of the bed model are subtracted from the height values hO of all surface measurements; this gives the respective value of the deposit thickness D. Since the position coordinates PO are known at the same time, the result is an area-wide representation of the deposit heights over the entire bed.
Figure 11: Determining the deposit thicknesses D
6. Further possible evaluations
This completes the basic evaluation of the measurements up to the area-wide determination of the deposit heights. Depending on the task, further evaluation steps are useful:
Sediment volume: The individual deposit thicknesses D are rasterized over the area of the bed (e.g. 1 m × 1 m) and summed. This gives the total volume of the deposits in m³. Areas that were not surveyed (e.g. because of vegetation) can usually be estimated plausibly and taken into account in the volume calculation.
Empty volume: The bed model can be used to determine the empty volume of the basin without deposits (at normal or maximum water level).
Remaining storage capacity: The remaining storage capacity can be derived from the empty volume or the sediment volume and stated in absolute terms in m³ or as a percentage.
Figure 12: Comparison with the design geometry yields deposit thickness and volume
First publication
This article was first published in the special issue “Messtechnik im Bauwesen 2023” (Ernst & Sohn Special 2023, section “Geopositionierung & Digitale Welt im Bauwesen”, pp. 31–33). The special issue (in German) can be ordered from the publisher Ernst & Sohn: Messtechnik im Bauwesen 2023 at Ernst & Sohn.
Have the sludge depth in your facilities measured?
With the Geospector Sludge Check, we survey the sediment surface and bed of your stormwater retention facilities area-wide by drone – without a boat and without the need for an existing baseline survey.